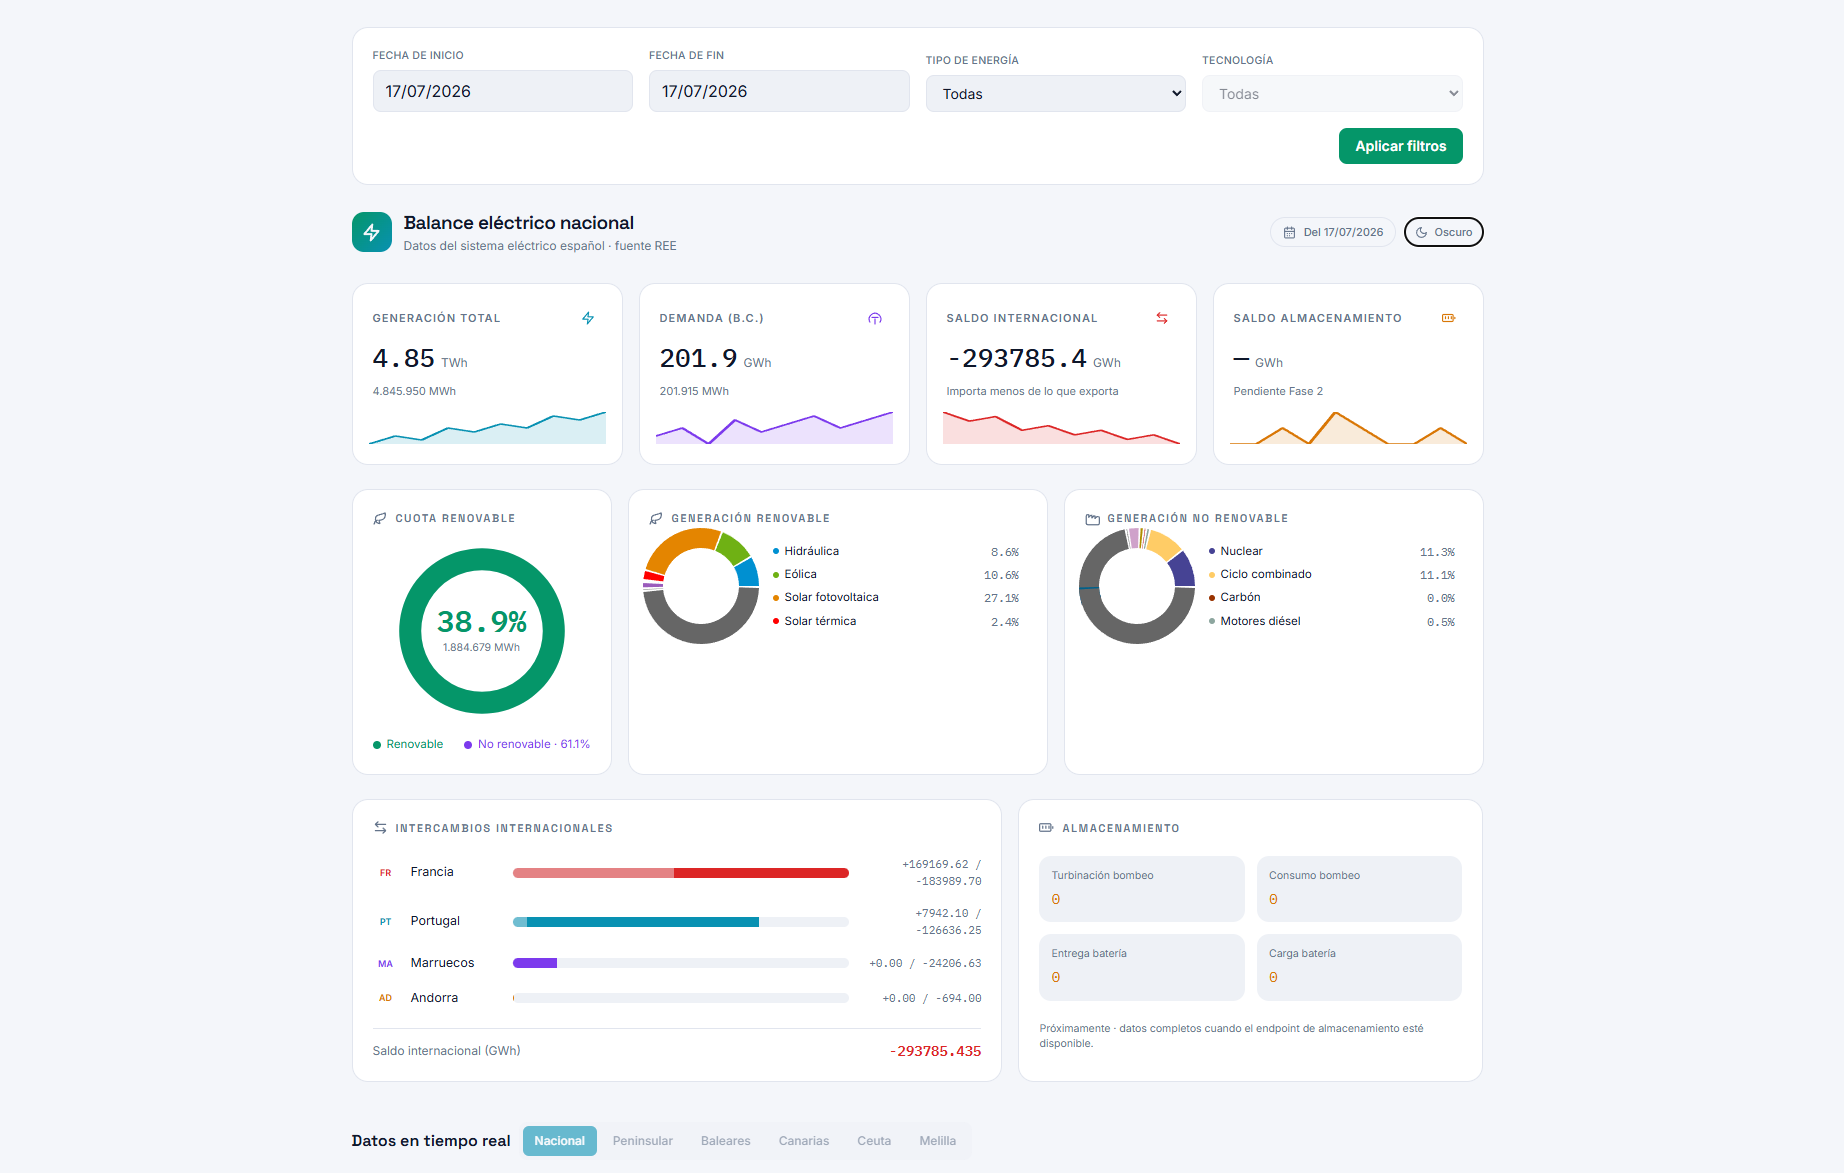
🧠 Project Overview
Goal: turn the public REE (apidatos) API into a visualizer that
answers the questions a curious reader of the Spanish grid actually
asks — where is the electricity coming from right now, how much are
we importing from Portugal, what share of the mix is renewable this
week, how is demand trending this month — without forcing that reader
to scrape endpoints or write a single line of code.
Ree View is built on top of the open endpoints REE publishes: generation by technology, system demand, international exchanges at the France / Portugal / Andorra / Morocco borders and storage balance (pumped hydro + batteries). The frontend ships a date-range picker and an energy-type filter (renewable vs. non-renewable), and the backend caches every REE response in MongoDB with a 24h TTL so a heavy exploratory session never trips REE’s rate limits.
Current features:
- Date-range filter through
react-datepicker, with validation on both ends so the GraphQL resolver never sees a malformed range. - Generation breakdown by technology — eólica, solar fotovoltaica,
hidráulica, nuclear, gas natural, carbón y resto — with totals and
percentage share, rendered as a stacked
rechartsBarChart. - Average system demand plotted across the selected window.
- Cross-border exchanges at all four Iberian borders, signed positive for import and negative for export, with a small dashboard card per neighbour.
- Storage balance for pumped hydro and batteries (charge / discharge).
- Light / dark theme via design tokens, with no flash of unstyled content on first paint.
🏗️ Architecture: Read-Through GraphQL on Top of REE
The runtime is two apps wired together over GraphQL — a Vite SPA on the browser side and a NestJS resolver layer in front of the public REE API on the server side — plus a MongoDB instance that fronts REE as a read-through cache.
graph LR
  BROWSER[Browser<br/>React 19 SPA] --> APOLLO[Apollo Client<br/>GraphQL queries]
  APOLLO --> NEST[NestJS resolver<br/>read-through cache]
  NEST -->|miss| REE[ReeClientService<br/>axios + class-validator]
  NEST -->|hit| MONGO[(MongoDB 6<br/>TTL 24h)]
  REE --> API[REE apidatos<br/>public API]
  REE -->|write| MONGO
This shape lets us:
- Treat REE as a swappable upstream by replacing
ReeClientServicewith another HTTP client — every resolver goes through that one seam. - Turn the cache TTL into a knob (
THROTTLE_TTL_MS) without touching any code — the read-through logic lives in the resolver decorator. - Stand up the entire stack with a single
docker-compose up— backend, frontend and Mongo come up together with healthchecks and a pre-warmed Mongo volume. - Iterate on the React side against a mocked backend in dev by flipping one env var, so the UI loop never blocks on the public API.
🧰 Technologies Used
⚛️ Frontend (frontend/)
- React 19 with concurrent rendering to keep the chart-heavy dashboard responsive on long date ranges.
- Vite 6 for the dev server and the production build — the hot reload on the GraphQL contract is the iteration loop that matters most.
- TypeScript end-to-end, with generated GraphQL types feeding directly into component props.
- Apollo Client as the GraphQL client, with a single
HttpLinkpointed at the backend endpoint. - Tailwind CSS 4 with design tokens that theme light and dark mode without a runtime CSS-in-JS layer.
- recharts for the responsive
BarChart/LineChartrendering of generation, demand and exchange series. - react-datepicker for the date-range input, with validation hooks bound to the resolver contract.
🔙 Backend (backend/)
- NestJS 10 as the application framework — modules, DI, decorators and lifecycle hooks line up 1:1 with the GraphQL surface area.
- GraphQL (Apollo Server) as the single contract between the frontend and the backend — no REST routes to keep in sync.
- Mongoose as the ODM over MongoDB 6 for the response cache.
- Axios as the HTTP client against the REE endpoints.
- @nestjs/throttler as a global rate-limit guard on the GraphQL layer, sized so a heavy exploratory session never crosses the upstream’s public API limits.
- class-validator + class-transformer for input shape validation on every resolver argument.
🔐 Key Technical Decisions
✅ 1. GraphQL as the contract, REST as the upstream
REE exposes REST endpoints whose shape changes per category.
Wrapping them behind a single GraphQL resolver layer means the React
client queries a stable contract — generation(range, type),
demand(range), exchanges(range), storage(range) — while the
backend absorbs every change in the upstream JSON into a small
adapter. If REE retires an endpoint tomorrow, only ReeClientService
moves.
✅ 2. MongoDB read-through cache with a 24h TTL
The public REE API caps well below the requests-per-second a
visualizer naturally produces (every filter change is a new query).
The backend caches every successful response in a responses
collection with a TTL index that expires documents after 24h, so the
steady-state cost on REE drops from “every page interaction” to
“one query per (endpoint, day)”.
✅ 3. @nestjs/throttler to protect the upstream
The cache hides the hot case; @nestjs/throttler on the resolver
layer hides the cold and abuse cases. Together they keep the
project well within REE’s public API limits without sacrificing
responsiveness on the frontend.
✅ 4. The smoke test is end-to-end possible because of the healthchecked Compose stack
The 6-phase end-to-end contract exercised by verify-stack.sh
(covered under 📦 above) only works because the 3-service Compose
file gates its startup ordering on healthchecks — without that gate,
CI would happily see up --build as “running” before the backend had
finished booting, and the smoke test would lie.
📦 Infrastructure and Deployment
The whole stack ships as a 3-service Docker Compose file, and the
same stack can also be brought up locally with two pnpm dev
terminals for hot reload on each side.
docker-compose.ymlorchestrating three services —backend(NestJS),frontend(Vite build served by Nginx),mongo(MongoDB 6 with a persistent volume, DBenergy-balance) — with healthchecks pinning startup ordering sodocker-compose up -d --buildalways converges on a queryable stack, not one half up.- Frontend served by Nginx inside the
frontendcontainer athttp://localhost:80, with a reverse-proxy pass to the backend’s/graphqlendpoint on the same Compose network. - Configurable via env:
CORS_ORIGINSwhitelist for the GraphQL resolver,MONGODB_URIfor the database (defaults to the in-stackmongocontainer),THROTTLE_TTL_MS/THROTTLE_LIMITfor the global rate-limit,VITE_API_URLinjected at build time pointing the SPA at the backend. - Smoke test: a
verify-stack.shscript exercises the 6 end-to-end phases (stack-up, the three GraphQL resolvers, rate-limiting and the Mongo TTL expiry) — useful as a sanity check after every change to the contract.
Local dev (two terminals, hot reload on both ends):
# backend
cd backend
cp .env.example .env   # tune REE_API_URL, MONGODB_URI, CORS_ORIGINS
pnpm install
pnpm run dev           # http://localhost:3000/graphql

# frontend, in a second terminal
cd frontend
cp .env.example .env   # VITE_API_URL=http://localhost:3000/graphql
pnpm install
pnpm run dev           # http://localhost:5173
Full stack with Docker (one command):
docker-compose up -d --build
# Frontend  → http://localhost:80           (Nginx → Vite bundle)
# Backend   → http://localhost:3000/graphql (GraphQL Playground)
# MongoDB   → mongodb://localhost:27017     (DB: energy-balance)
📈 Current Outcome
✔️ Full-stack visualizer deployable with a single
docker-compose up and queryable end-to-end through GraphQL.
✔️ Read-through cache keeps public-REE traffic flat under heavy exploratory sessions, with a 24h TTL knob tunable via env.
✔️ Smoke test passing the 6 end-to-end phases — stack-up, every resolver and the rate-limit guard.
✔️ Frontend usable against a mocked backend in dev so the UI loop never blocks on the public API.
📎 Conclusion
Ree View shows that a public, real-time data source can power a production-shaped data product without taking on any cloud dependencies: one NestJS graph in front of REE, one MongoDB collection acting as a cache, one Vite SPA reading the contract, and one Compose file holding them together.
The architectural decisions — GraphQL as the single contract, a read-through cache with TTL, a throttler on the resolver layer, and a Compose healthcheck-pinned stack — were driven less by novelty than by the simple rule that the public REE API should not feel like the bottleneck of the visualization.
Want to read the source or run it locally with your own REE API credentials?
-🔗 Live demo